How to analyze the financial health of your practice in Excel with the Provider Analysis Summary Dentrix report
Last updated: October 10, 2025 by Jason Shah
Why analyze your practice's financial health with the Provider Analysis Summary report
This report provides a lot of detail about the financial health of your practice's top line. It lists production, payments, adjustments, finance charges, billed to insurance, new and total patients seen, average production per patient, average charge per procedure, previous balance, balance, and net change by provider, grouped by time period, MTD, YTD, and previous month.
Understanding these metrics is crucial for:
- Identifying your most productive providers and understanding their performance trends
- Analyzing patient flow and retention by tracking new vs. total patients seen
- Monitoring collection efficiency by comparing production to payments received
- Spotting potential issues with adjustments or write-offs that may be impacting profitability
- Benchmarking provider performance against practice averages
- Making data-driven decisions about staffing, scheduling, and resource allocation
How to generate the Provider Analysis Summary report
First, you need to generate the Provider Analysis Summary report from Dentrix for the time period you want to analyze.
However, like almost all Dentrix reports, it's not possible to export the report into a file that you can work with in Excel or Google Sheets. That's where Dentrix Report Converter can help.
Here's how to do it:
Open Dentrix Office Manager and log in.
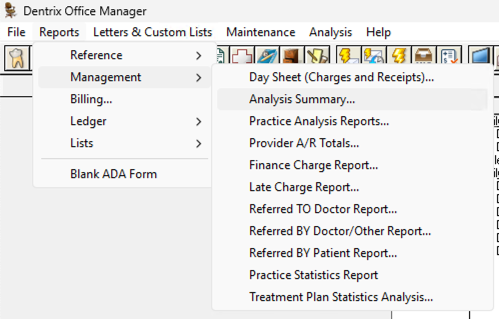
Click on Reports menu > Management > Analysis Summary...
Step 2: Configure the Report Settings
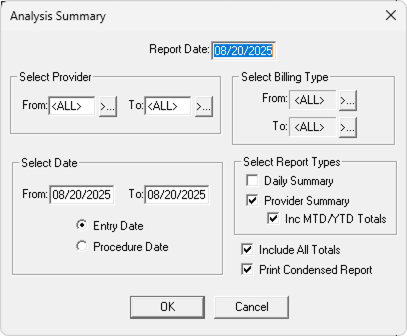
A dialog box will appear, allowing you to configure the report settings. The key settings for the Provider Analysis Summary are:
- Report Date - the effective date of the report
- Providers - Choose specific providers or select "All" to include everyone
- Billing Type - choose "All" to include all billing types
- Select Date - choose the date range for the report. Usually you would choose a month, quarter, year to date, etc.
- Report Types - choose "Provider Summary" and include Month To Date and Year To Date Totals. Don't check "Daily Summary" otherwise this changes the structure of the report entirely.
- Configure any additional filters as needed for your analysis
Step 3: Generate and Export the Report
Click on OK to generate the report into the Batch Processor in Office Manager. Then double click on it to open it to Print Preview.
Tap on File > Print Report.
Look for a printer that says something like "Print to PDF", and choose that one. That printer will allow you to "print" the report to a PDF file on your computer.
Click on OK and save the PDF to your computer.
Converting to Excel for Analysis
Log into your Dentrix Report Converter Dashboard.
Drag the Provider Analysis Summary PDF file into the upload area
Tap "Upload and Convert"
Within seconds, you will receive a link to download your report in Excel format. You can also export this to CSV or upload it to Google Sheets for further analysis.
Key Metrics to Analyze in Excel
Once you have your Provider Analysis Summary in Excel, you can perform various analyses to understand your practice's financial health:
Production Analysis
- Production per Provider - Compare total production across providers to identify top performers
- Average Production per Patient - Calculate efficiency metrics to understand provider productivity
- Production Trends - Compare MTD, YTD, and previous month data to identify growth or decline patterns
Collection Efficiency
- Collection Ratio - Calculate payments received divided by production to measure collection efficiency
- Adjustment Analysis - Review adjustments as a percentage of production to identify potential issues
- Insurance Billing - Analyze amounts billed to insurance vs. collected to understand reimbursement patterns
Patient Flow Metrics
- New Patient Acquisition - Track new patients by provider to measure growth
- Patient Retention - Compare total patients seen to new patients to understand retention
- Average Charge per Procedure - Monitor pricing consistency and identify opportunities
Creating Dashboards and Visualizations
With your data in Excel, you can create powerful visualizations to better understand your practice's performance:
- Create pivot tables to summarize data by provider, time period, or other dimensions
- Build charts to visualize production trends, collection ratios, and patient flow
- Set up conditional formatting to highlight providers or metrics that need attention
- Calculate key performance indicators (KPIs) like production per hour, collection percentage, and patient growth rates
How much does Dentrix Report Converter cost?
Upload and convert your reports for free, and download a sample Excel file with the first five rows of data. When you are ready to download your converted Excel file, please purchase one of our plans: